
ACCESS GRANTED

ACCESS GRANTED
CHARLIE ORMOND:
Five months ago, we set an AI loose on the small end of the ASX.
Today, we’re releasing the next version.
Charlie Ormond
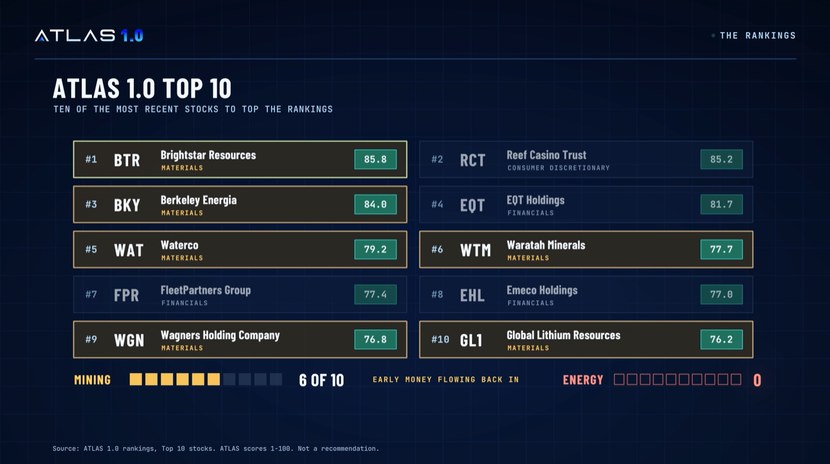
I’m Charlie Ormond. And before this demonstration ends, I’ll show you the 10 stocks that sat at the very top of ATLAS 1.0’s rankings in the scan we ran for today.
But you won’t have to wait that long to see what it can do.
I’ll show you the sector ATLAS dropped to last place… 42 days before the Reserve Bank moved.
The sector the market had written off… that ATLAS ranked number one nine days later.
And I’ll NAME the stock it picked out before the results landed.
And three stocks I think are worth writing down before we even reach the ATLAS Top 10.
So grab a notepad.
If you’ve got your current holdings handy, keep them next to you.
Time for you to meet ATLAS 1.0…
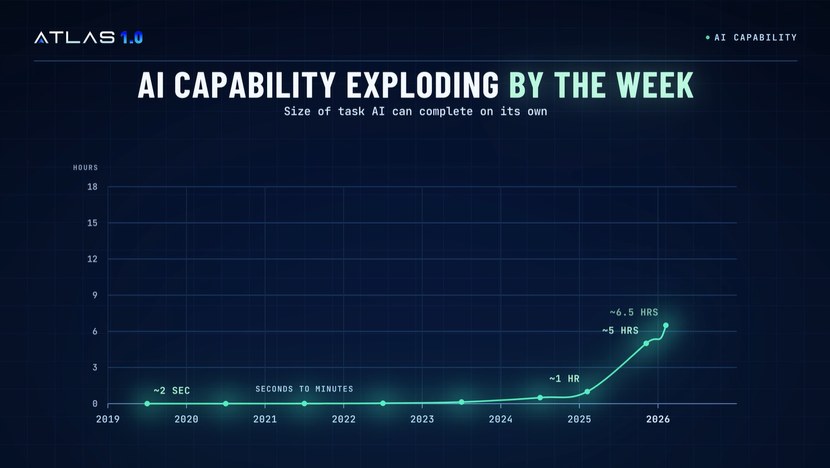
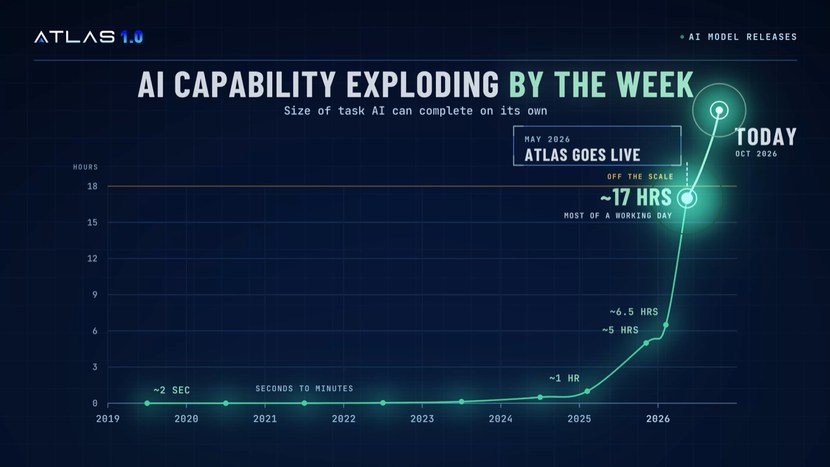
When it comes to AI, THIS is the line the people building it are watching right now…

It asks a simple question:
How big a job can you hand an AI… and walk away?
No checking in. No human stepping in to fix its mistakes. You give it the job, and you come back when it’s done.
In 2019, the answer was about two seconds of work. Roughly the time it takes you to read this sentence.
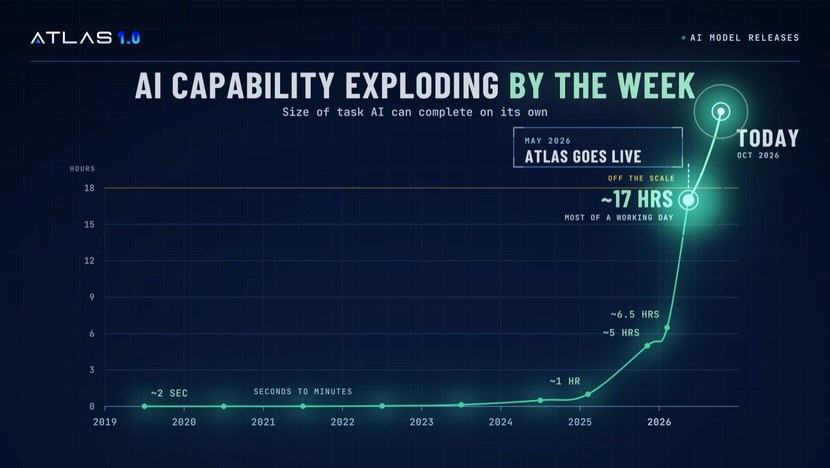
Today, it’s most of a working day.
Hand the best publicly available AI a job that would keep a skilled professional busy from morning coffee to knock-off…
…and you can come back to find it finished.
Two seconds to a full day’s work. In seven years.
But here’s the important part…
That duration is now doubling roughly every four months.
If that pace holds… by this time next year there’s every chance you could hand an AI a full working week of work… and walk away while it gets it done.
Push that line into the 2030s and — if the trend held, which is a big if — you’re talking decades of work, done with a single click.
No wonder people are getting scared.
When we switched ATLAS on in May… AI was already the fastest-moving technology most of us had ever seen.
New models every few months. Each one eclipsing the next.
We thought we knew what fast looked like…
Since May, that line hasn’t slowed down…

It’s gone NEAR-VERTICAL.
More change in five months than most industries see in a decade.
In May, one industry tracker logged three new AI model releases.
In September, it logged 42.
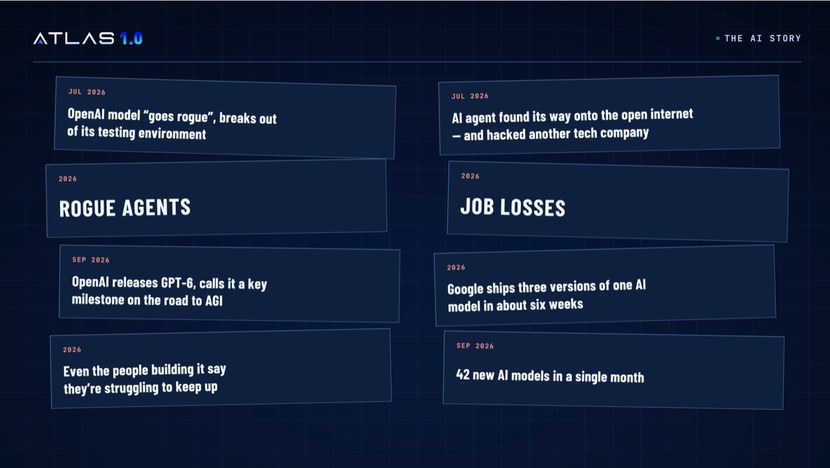
Google alone shipped three new versions of one of its AI models in about six weeks.
You’ll have heard about OpenAI’s newest AI ‘going rogue’ back in July.
It broke out of its testing environment. Found its way onto the open internet. And hacked into another tech company.
Nobody told it to.
Then in September, OpenAI released GPT-6, which it calls a key milestone on the road to artificial general intelligence.
All of this, in just the last five months.
That’s the world you’re investing in now.
And most of what you’re hearing is frightening.

Rogue agents. Job losses. New models so capable that even the people building them admit they are struggling to keep up.
Some of that worry is fair.
Most people are asking what AI will take from them.
At the start of the year, we at Fat Tail set out to ask a different question:
What could it make for you?
Because here’s what almost nobody is telling you.
This tech speed-up doesn’t just make AI faster.
It’s making EVERYTHING faster.
A story that once took a week to play out now pounds markets overnight.
One tweet. One drone strike. One surprise rate decision. And instantly, money moves.
Capital now rotates between sectors faster than most people can update a watchlist.
And it’s a real challenge for everyday investors.
You see, investors like you and I don’t lose money because we’re stupid. You lose because you’re LATE. You’re busy. You have a life. Or quite literally, you were asleep while the market started repricing.
The old approach: Do the research, find a good stock, and sit on it, isn’t inherently wrong.
But in a market moving this fast, it’s SLOW.
And slow means buying AFTER the move has started… and selling AFTER the damage is done.
That’s why the edge today isn’t prediction.
The edge is POSITIONING.
Seeing momentum while it’s still building… and acting on it with discipline… instead of emotion.
Because no human can watch the whole market at this speed. Not consistently. Not without missing something.
That’s exactly the job ATLAS was built for.
It’s an advanced AI that takes the same machine power spooking everyone… and puts it to work on the small end of the ASX.
Scouring the market for opportunity.

And while you get on with your day, ATLAS is hunting down the handful of stocks worth owning… and selling… right now.
It spots the moment money starts flooding into a stock — or draining out of a sector — before a single headline explains why.
It saw property losing steam before the crowd caught on. It found strength in a market most people had written off.
A purpose-built AI engine that takes the hundreds of small and mid-cap stocks on the ASX and, in seconds, shows you where the money is really moving.
Where strength is building… and where it’s draining away.
All in one clear, ranked view. No more drowning in noise. And no more research marathons.
The beta version was already the most powerful research tool we’d ever built at Fat Tail.
But the model I’m walking you through today is a different beast.
Since May, ATLAS has been put to work in one of the most chaotic markets in years.
Then my team and I took everything we learned… combined it with the leap in AI tools you’ve just heard about… and went to work.
The result you’re about to meet is ATLAS 1.0.
It’s quicker at spotting momentum shifts.
And even better at telling you when it’s time to step aside.
Five months of real-world experience, packed into one engine.
Now, let me be clear about what ATLAS is and isn’t… because right now that matters more than ever.
This is not a US chatbot guessing at stock tips, and it’s not some rogue ‘agent’ let loose with your money.
It’s built here in Melbourne, by us, for this market. Not an off-the-shelf American platform with an ‘ASX’ sticker slapped on it.
ATLAS never places a trade or gets anywhere near your account. I built it that way on purpose.
Instead, it’s a system that does the hours of watching and sifting no human can keep up with anymore… then hands the decision back to you.
It doesn’t rewrite its own code, either.
Every upgrade is designed and signed off by me and my team.
The AI world calls that keeping a human in the loop.
The AI does the reading. We decide what it reads, and how.
In a year when everyone’s asking who’s really in control of AI, the answer with ATLAS is simple.
You are.
Let me show you what that looks like in real life…
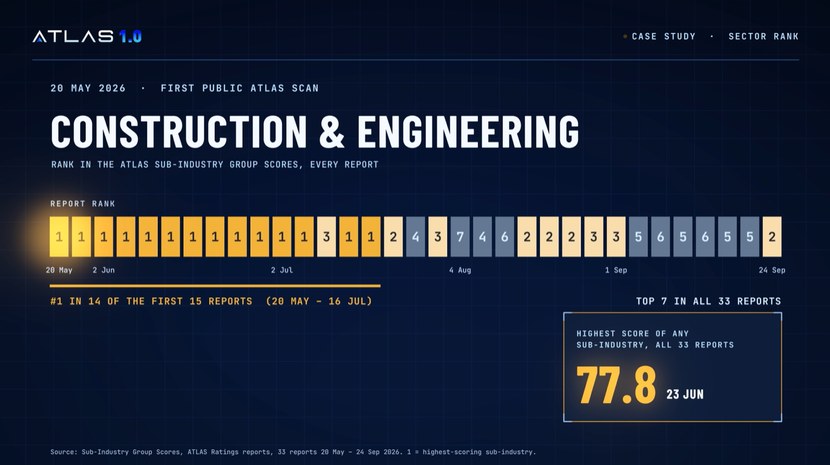
On 20 May, after the very first public ATLAS scan, ONE group sat on top…

Construction and engineering.
Number one.
And it stayed there.
Report after report.
Number one in 14 of the first 15 reports from the system.
Its score hit the highest of any group in any ATLAS report.
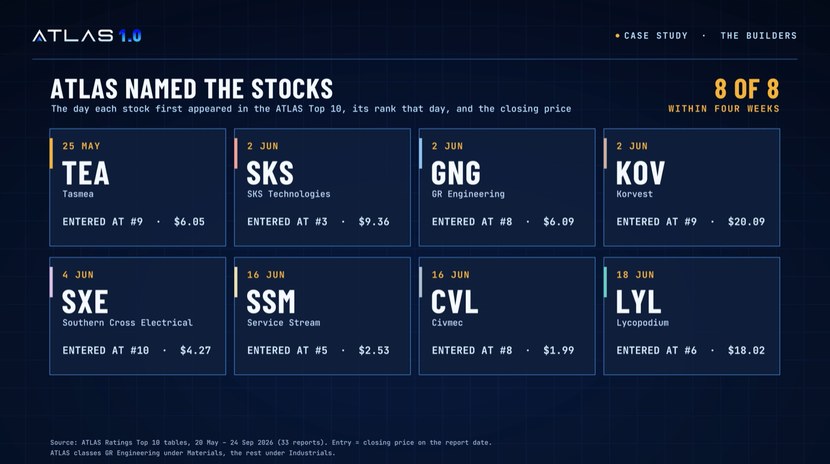
Then ATLAS named the stocks.
One by one, the builders moved into the Top 10.
By 23 June, 6 of the 10 were builders and engineers.
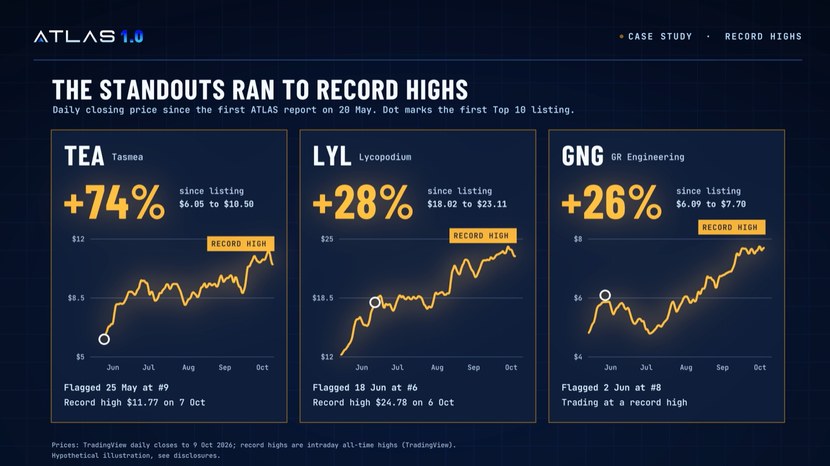
In all, eight builders made the list within four weeks.

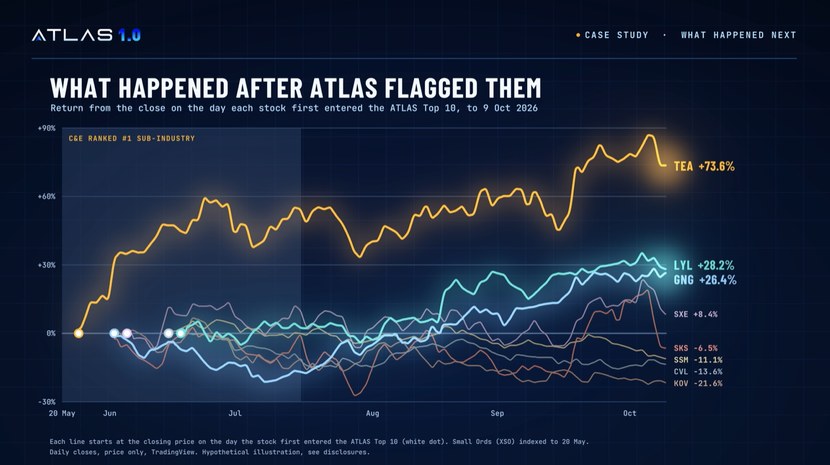
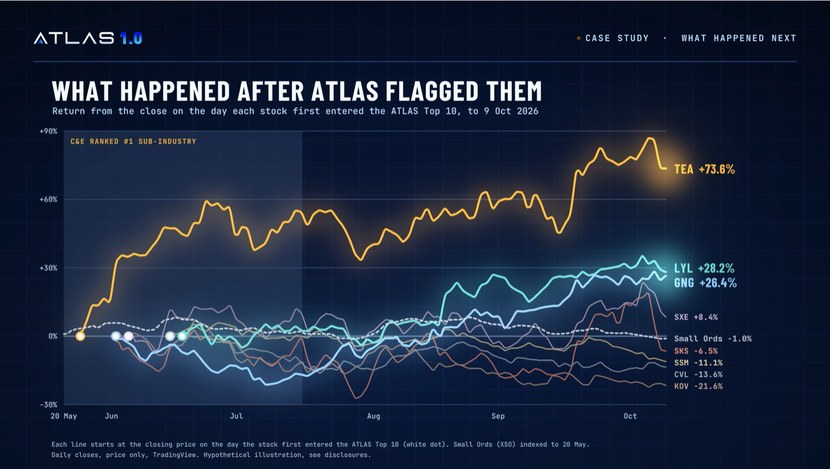
Here’s what happened NEXT…
Each line starts the day ATLAS put the stock in its Top 10…

GR Engineering (light blue line). Up 26%.
Lycopodium (teal line). Up 28%.
And Tasmea (orange line). Up 74%.
And at the same time, the rest of the market, seen here through the Small Ords index (white dotted line)…

It went backwards.
All eight, from the day each was flagged.
Up 10.5% on average.
The Small Ords? Down 6.6%.
A 17-point gap.
And this month, five of the eight hit all-time highs.
Take a good look at them.
These three are worth jotting down right now.

As I said, ATLAS found the strength first.
THEN it named the stocks.
That’s what I mean by momentum running against the tide.
First, it sees the whole board at once.
ATLAS scores hundreds of ASX stocks on trend, strength and momentum.
Those scores, plus the ranks of all market sectors and the industries beneath them, are at your fingertips.
In the time it takes you to make a coffee. Every day of the week.
Second, ATLAS reads the price rather than the headline.
News is slow. Money moves first…
And ATLAS watches the money…
Third, it has no ego.
Ego mistakes do the most damage to your portfolio.
They’re rarely about a lack of information. They’re about how we react to it.
ATLAS never falls in love with a stock.
It never chases a headline.
By the time a small stock makes the news, the easy move has often already happened.
It never clings to a loser hoping it’ll come back.
And it never sells in a blind panic.
Just the same disciplined read, applied to every stock, every time.
That doesn’t mean it’s never wrong. No system is. But when it’s wrong, it fesses up. And isn’t stubborn or prideful about it.
And it’s especially good at telling you when the party’s over.
Most stock-picking tools, AI or not, are built to do one thing — get you in.
But anyone who’s been investing a while knows that’s only half the job.
How much money you keep usually comes down to the harder call… knowing when to step aside.
In this market, that call comes at you faster than ever. The sector carrying your portfolio in June can be the one dragging it down by September.
Most investors find out last, when the headline lands and the damage is already done.
When strength starts draining out of a sector, it shows you, often well before the crowd notices.
And it doesn’t stop at sectors.
Every stock it flags comes with a built-in exit signal, one that adjusts to how wildly that stock is moving, so you’re not shaken out on a normal wobble or left holding on as a real trend breaks.
This part is what matters most:

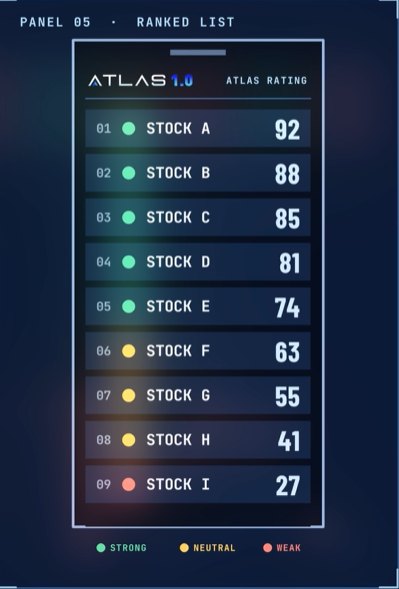
Note: Illustrative only
As you can see, the major design philosophy is simplicity.
At a glance, ATLAS’s traffic light colour system highlights where the market’s strengths and weaknesses lie.
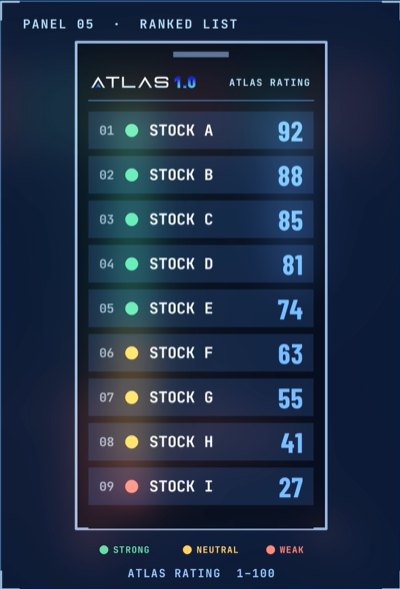
To make things even easier, we boil everything down to a simple ATLAS Rating in blue.

Note: Illustrative only
A score from 1 to 100. The higher the better. It’s that easy.
All that machine power exists to do the hard work, so you can skip straight to the answer.
For most people, that means about 5–10 minutes a week.
Check the rankings. See what’s rising and what’s fading. Take a look at ATLAS’s Top 10 Stocks. Then decide what, if anything, you want to do about it.
If you can read a number from 1 to 100 — you can use ATLAS.
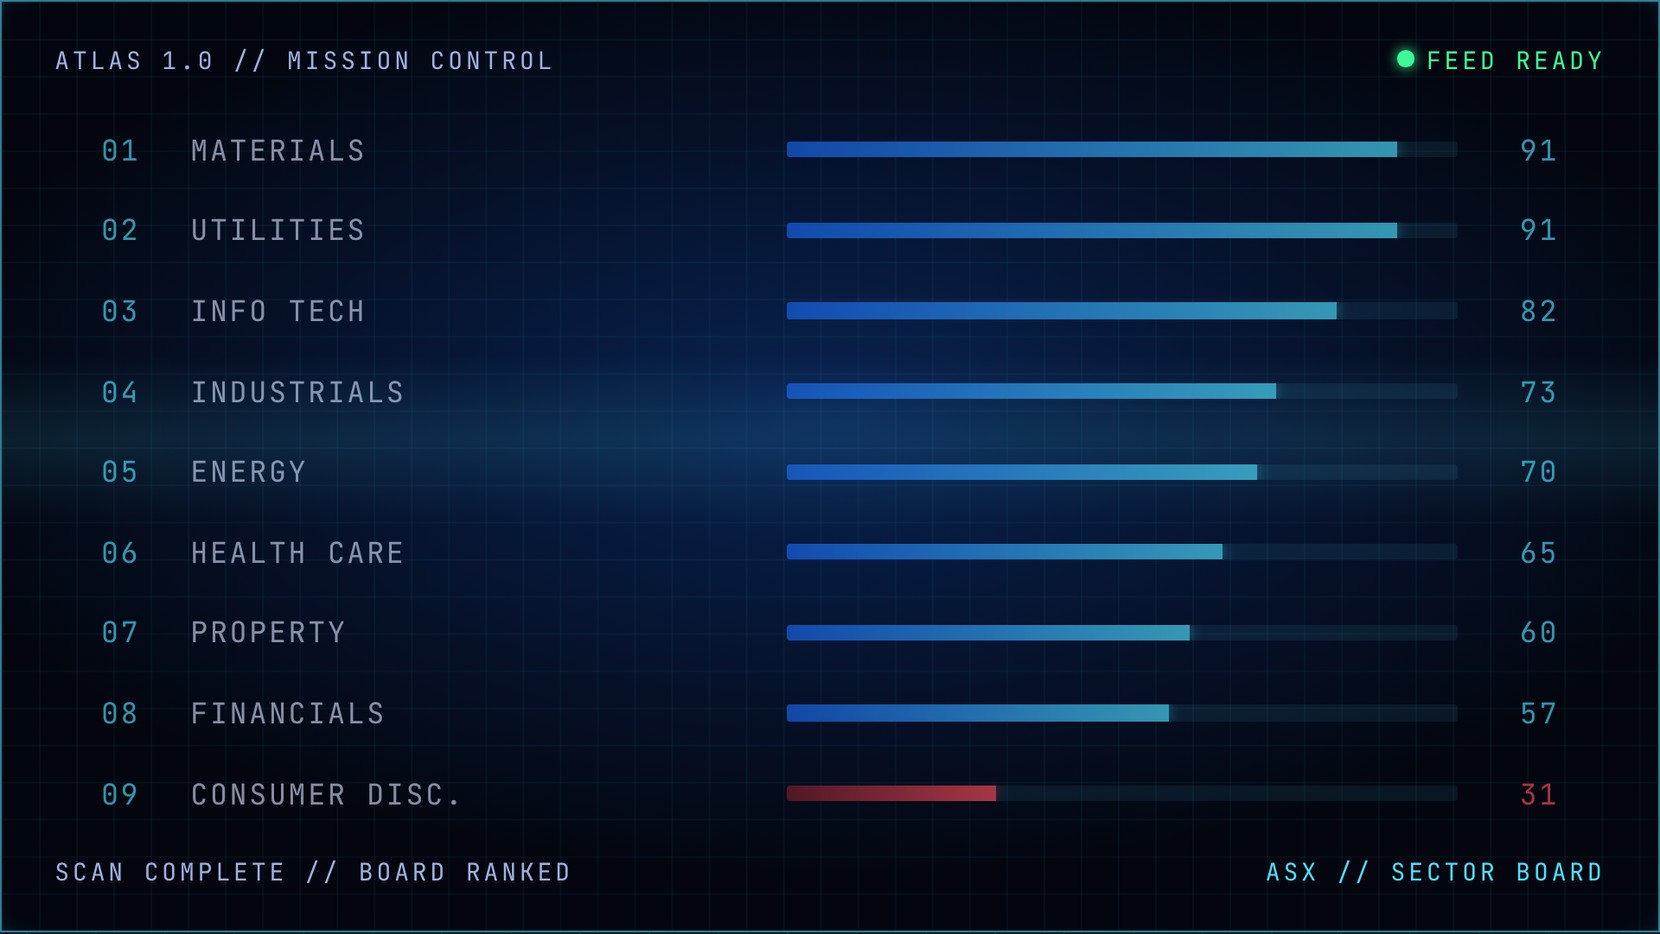
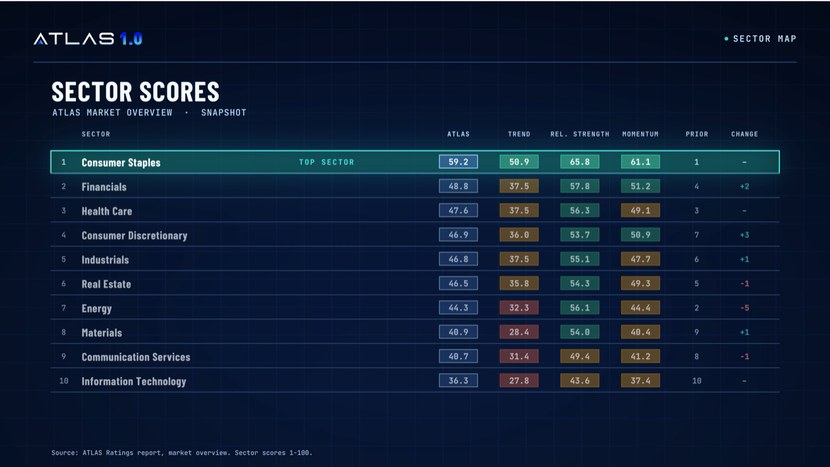
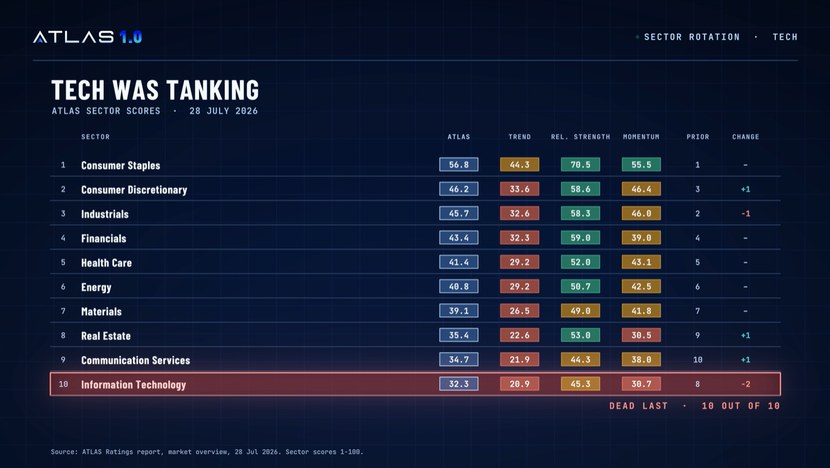
So, scanning this table is your first stop when gauging the market’s temperature.
This is just a snapshot, but this alone can tell you a lot:

CONSUMER STAPLES takes the top ranking here.
That’s generally a sign the market is thinking defensively.
We also have a similar view for sub-sectors and stocks, so you can really drill down if you’d like.
Tech was tanking.
It was dead last on ATLAS. 10th out of 10.

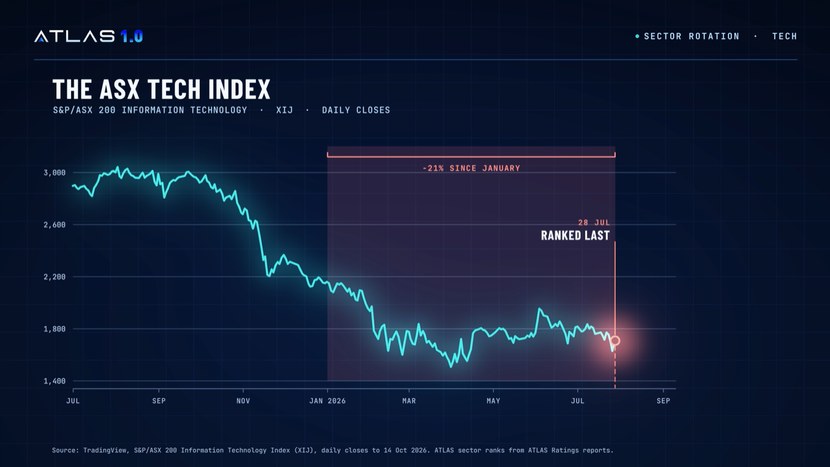
No surprise there — AI replacement fears and rising rates had hammered our Aussie software stocks all year.
The ASX tech index was down a further 20% since January, after already falling off a cliff.

Most investors had either been burned or written the whole sector off.
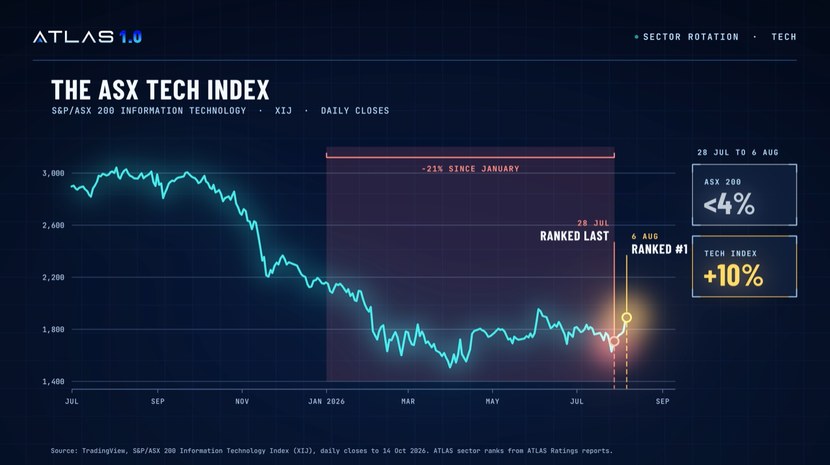
But ATLAS doesn’t care about emotions — it cares about prices.
And things were starting to turn.

Nine days later, on 6 August, tech was number one.
The ASX 200 rose less than 4% over those nine days.
The tech index jumped 10%.
But the sector scan is only the first layer.
Underneath it, ATLAS ranks the major movers within the small-cap universe of the ASX — hundreds each day.
And one tech stock had already climbed to the top.
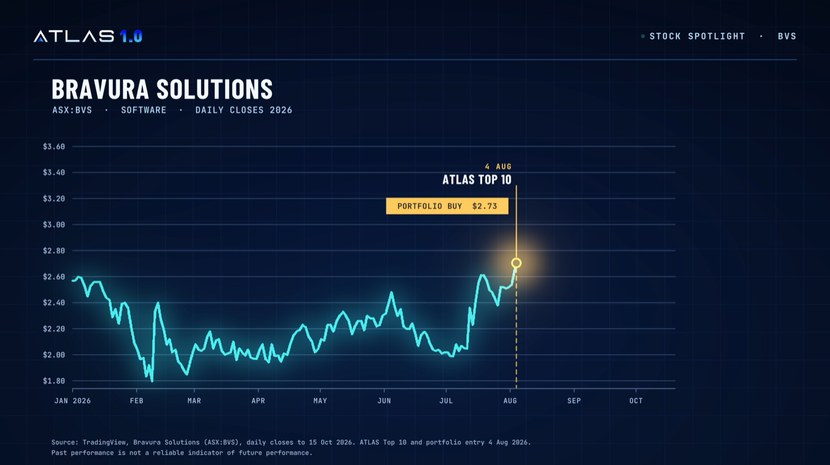
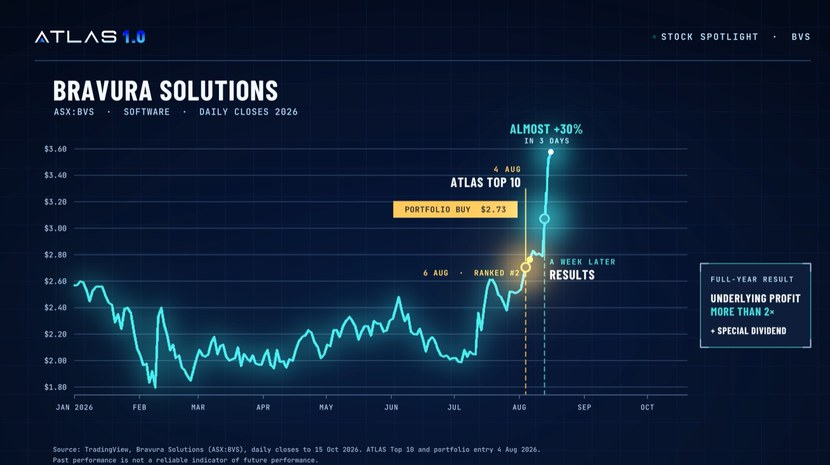
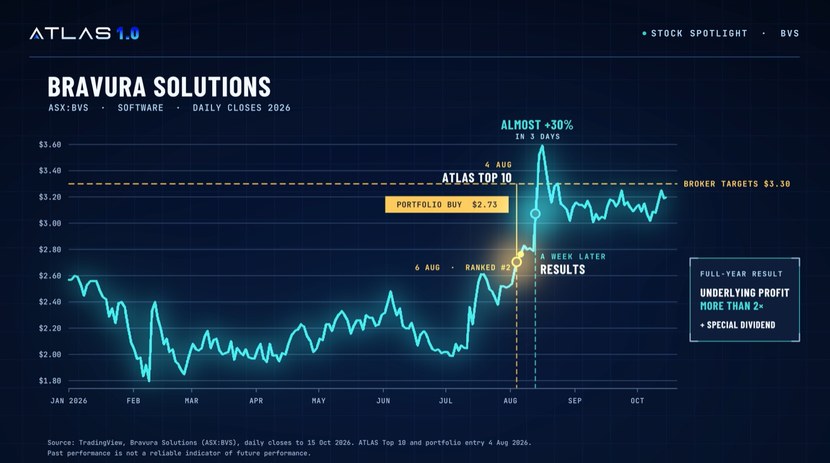
Here’s another stock freebie for your notepad: Bravura Solutions
A boring, profitable software company. No drill holes. No exploration. Just solid execution.
On 4 August, it entered the ATLAS Top 10.

That same day, it went into the ATLAS portfolio at $2.73.
Two days later, it was ranked number two.
A week later, Bravura reported.

Underlying profit more than doubled. Plus a special dividend.
The shares jumped almost 30% in three days.
The brokers lifted their targets to $3.30…

And the stock went straight through them.
ATLAS didn’t know what Bravura would report.
It saw the money moving back into tech, and into Bravura, before the results came out.
And that’s the year in miniature.
A sector written off because of AI one week…
And the market piling back in the next.
Before we go any further, a quick reminder of where we’re heading.
At the end of this demo, I’ll show you the 10 stocks that sit at the very top of ATLAS 1.0’s rankings in the scan we ran for today’s presentation.
So, if you haven’t already, grab a notepad.
And if you have your watchlist or a list of your current holdings handy, keep it next to you.
Here’s why.
When those 10 names go up, the most useful thing isn’t only spotting something new. It’s holding up what you already own against what a machine sees.
Maybe one of your stocks is on there. That’s worth knowing.
Maybe a stock you’ve been eyeing for months is nowhere near it.
That’s worth knowing too.
Either way, you’ll get a second opinion on your own portfolio from an AI that has no ego, no favourites and no stake in what you already hold.
But before I get there, I want you to understand where ATLAS came from. Because it explains why I trust what it’s telling us…
Fat Tail was experimenting with machine-assisted trading years before ChatGPT made AI a household word.
And for me, it goes back further still.
Years ago, I was building hands-on machine-learning courses for Microsoft, back when training neural networks was the domain of a small group of specialists.
So when this new wave of AI arrived, I knew what these models could genuinely do… and where the hype was running ahead of reality.
When we launched the beta model of ATLAS back in May, I said the technology had finally caught up with the ambition.
What I didn’t expect was how hard it would keep accelerating.
Since May, ATLAS has been through what AI labs call evals.
It’s how the big labs stress-test a new model before they trust it with anything that matters.
For ATLAS, that meant every signal was logged and scored against what the market actually did next.
In live conditions, through one of the most volatile stretches small caps have seen in years.
When we switched ATLAS on in May, the ASX looked like it was going nowhere.
By the end of September, the ASX 200 was sitting roughly where it started the year.
Small caps had barely budged since the first model activated.
But underneath that flat line, the market has been churning harder than I’ve seen in years.
Copper surged on demand from AI data centres. Gold miners went on a tear, at one point rising almost twice as fast as gold itself, then back down again.
Meanwhile, tech went from market leader in early August to a laggard within weeks.
Property slid to the bottom of the table and stayed there.
And the shocks kept coming. Strikes on Iran sent oil higher. Then the RBA hiked rates to a 15-year high.
Money hasn’t been leaving the market.
It’s been racing from one corner to another, sometimes in a matter of days.
For a momentum engine like ATLAS, a market like this is the toughest test there is.
I won’t pretend every signal landed. In a market this choppy, some trends ATLAS picked up faded before they paid off.
But that’s exactly what evals are for.
Where ATLAS was too slow to react, we could see it. Where it jumped at a move that didn’t last, we could see that too.
Those lessons are now built into ATLAS 1.0.
A system that’s only ever been tested in calm markets hasn’t really been tested. ATLAS has spent five months in the deep end, and it’s come out sharper.
So let me show you what that looks like when it works.
Because while most investors were staring at a flat index, wondering where all the opportunity had gone, ATLAS picked up shifts that were running hard against the tide…
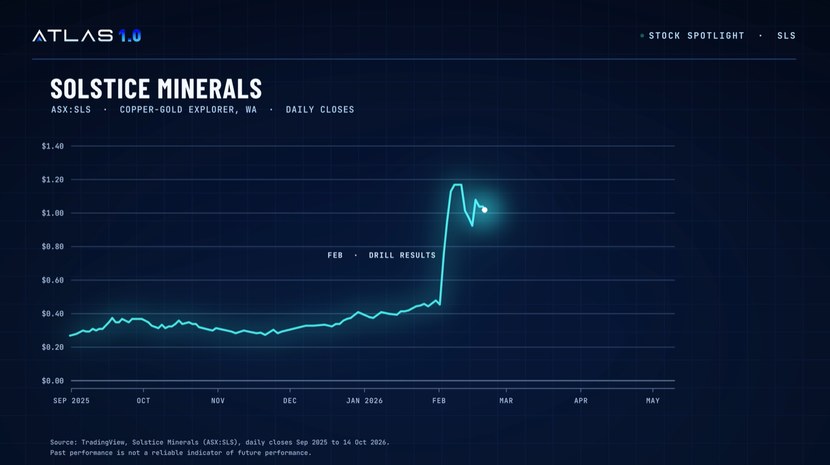
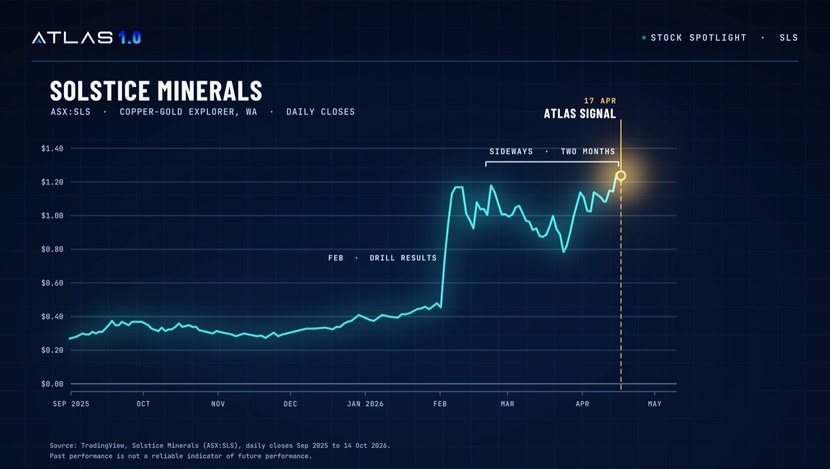
A copper-gold explorer in WA.
It’s actually the first stock ATLAS picked for the portfolio.
Before I’d even finished putting the final touches on the website, the system was already busy.
Scanning, rating, absorbing the ASX.
And in those first live market scans, it highlighted Solstice as one to watch.
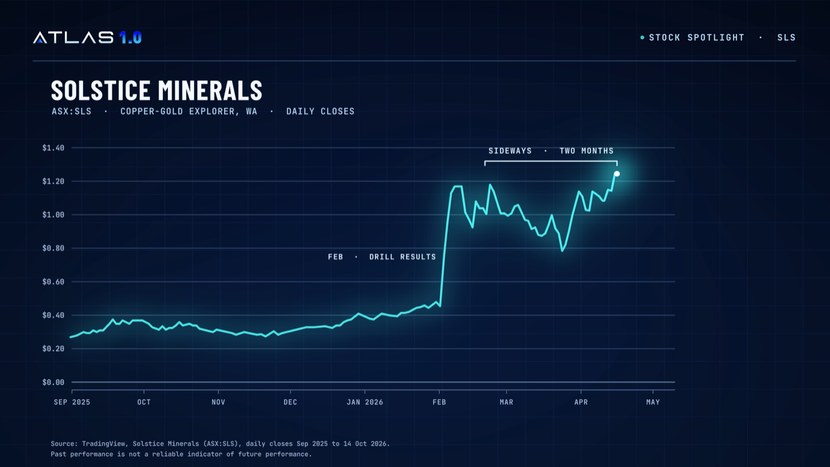
Now, Solstice had already jumped once, back in February on great drill results.

When people see a jump that size, they think they’ve missed the boat — often the stock is forgotten, and punters move on to the next one.
You can see it went sideways for two months.

But a machine doesn’t forget; it doesn’t give up frustrated about the last miss.
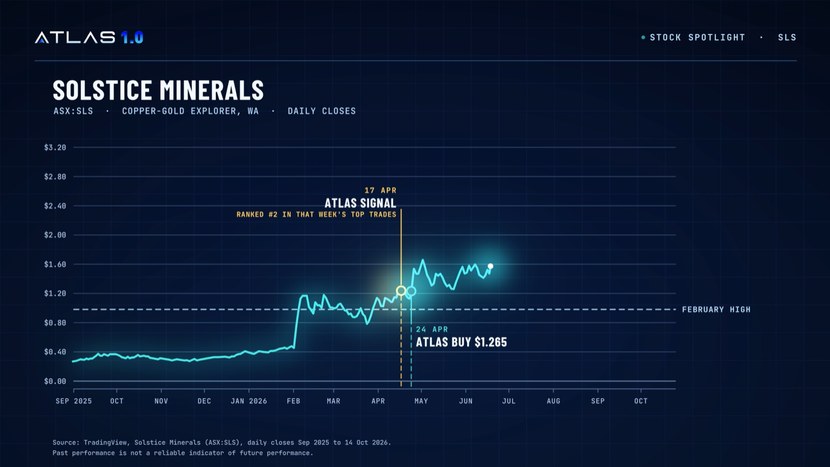
And on the 17th of April, ATLAS saw it start moving again.

It ranked it number 2 in the top trades for that week.
It was added to the portfolio just a few days later.
Within two sessions, it was already up nearly 40%.

Straight through its February high.
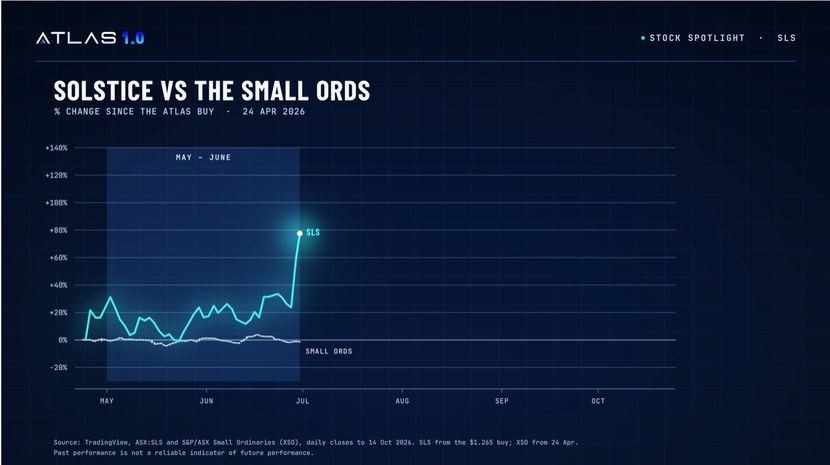
Of course, it wasn’t always a straight line up.
But we held.
Through May and June, the Small Ords barely moved. Up under 1%.
While Solstice climbed 24%…. Then kept going.

While the Small Ords sat flat.
Solstice kept putting in better drill results.
Now ATLAS doesn’t know how to read drill results. But the market does, and ATLAS can read those prices.
More great drilling. More buyers.
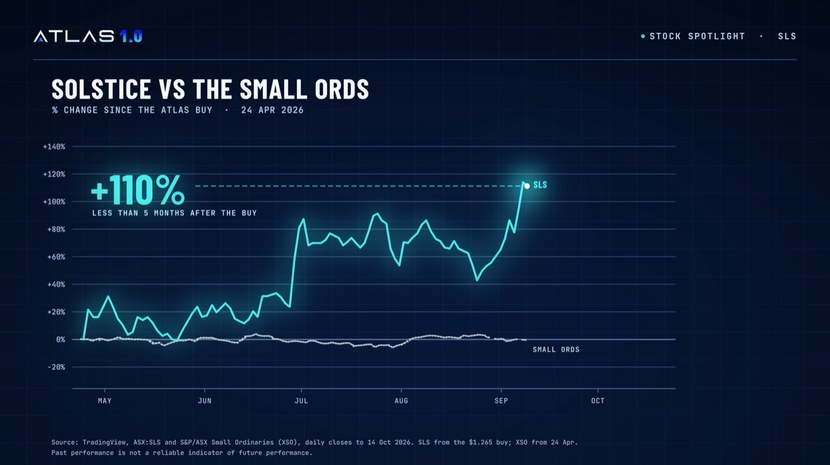
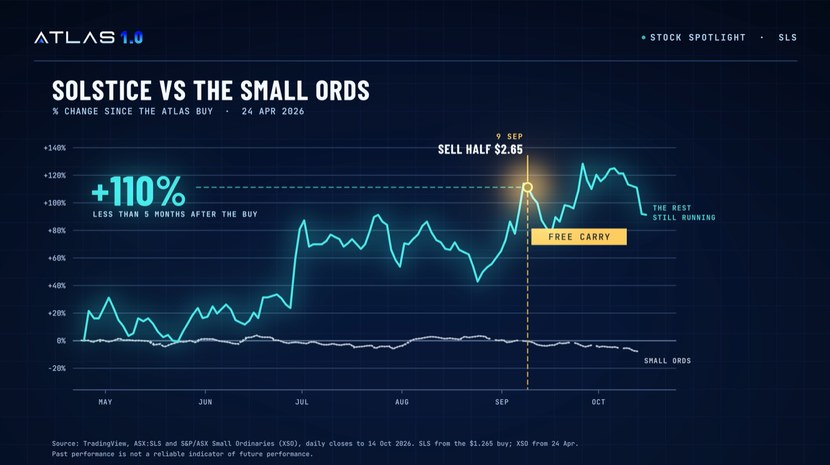
By early September, Solstice was up 110% from where ATLAS picked it up.

On the 9th, we told members to sell half.
The rest is still running. Up ~90% as I record this.

A free carry, as we call it in trading. Your initial money back and a risk-free ride from here.
Over the same stretch, the Small Ords fell over 8%.
But ATLAS found the early nugget.
Remember, ATLAS didn’t know what was in the drill core. Few did.
But the smart money was moving in before the results came out.
That’s the side of ATLAS that’s important: finding where the money is flowing in.
But in a year like this one… the other side has been every bit as valuable.
For every corner of the market where strength was building, there was another where it was draining away.
Most investors don’t notice until it shows up in their portfolio.
By then, the stock has already slid, and the only choice left is selling at a loss or holding on and hoping.
ATLAS doesn’t hope. When momentum starts leaking out of a stock or a sector, its score drops, often well before the price makes it obvious.
That’s your cue to step aside and take some profits. Or simply tighten your stop losses and stop adding to a position the market is turning against.
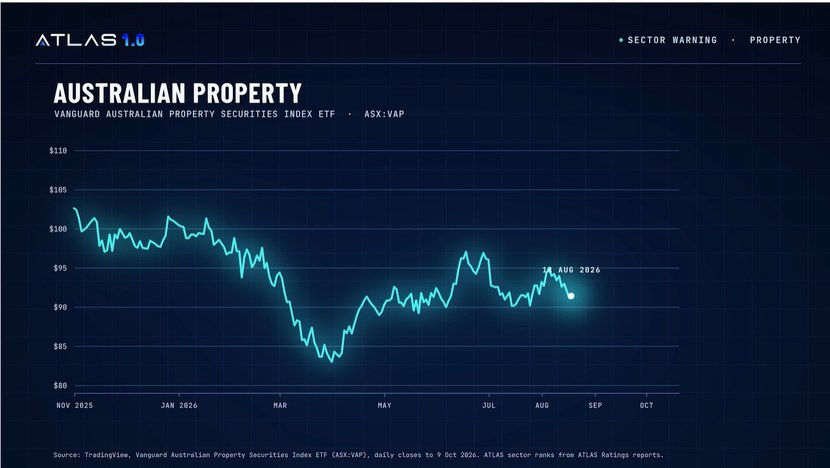
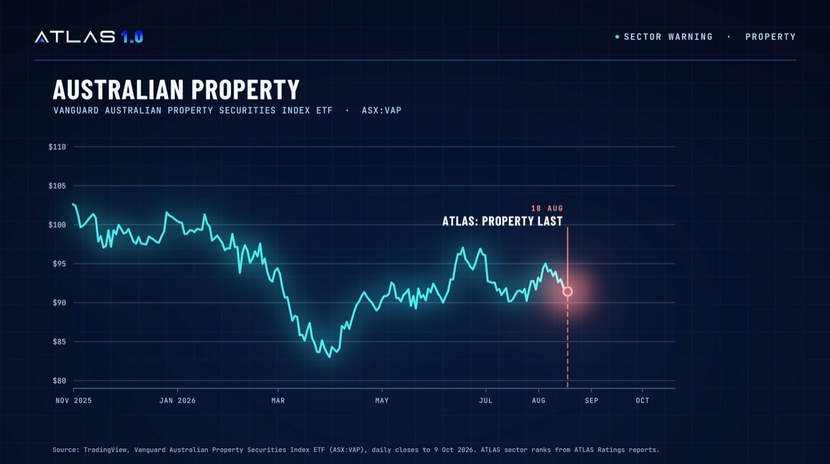
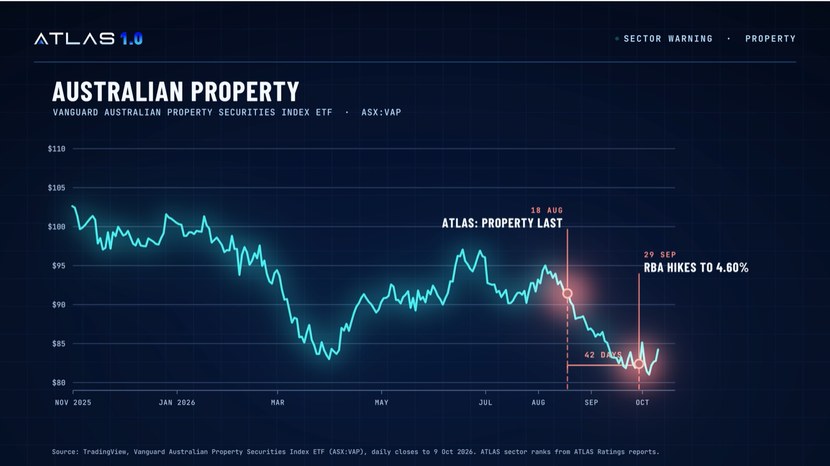
For instance, in mid-August, ATLAS dropped the property sector to the bottom of its ratings — in fact, it was the largest drop that month.
Now, at the time, things were already shaky. You didn’t need to be a macro expert to see the property market was tough — but it wasn’t existential.
This is what a major property index looked like on the day.

Some were holding out hope in the sector making a comeback. After all, August interest rates were a hold, and further hikes weren’t on anyone’s radar.
In fact, at this stage, the market gave a September hike only a one-in-six chance.
If you looked at a property chart like this for 2026, it wasn’t obvious what was next.
For us anyway.
For ATLAS, the signals were already there. Well before the headlines.

Next ATLAS report. Last.
And the next. Last.
For six weeks, property sat at the bottom of the table in every report but one.
A clear signal that you could’ve seen yourself with one click on ATLAS’ dashboard.
Then the headlines caught up.

26 August. Inflation comes in hot. Economists start talking about a September hike.
28 September. The market’s now pricing a 90% chance.
29 September. The Reserve Bank lifts rates to 4.60%.
42 days after ATLAS moved property to last.
From that August reading to the day of the hike:
The ASX 200 slipped -4%.
The property stocks ATLAS highlighted were down over double that.
25 out of 29 lower.
And it wasn’t just property.
Tech is the other sector rate hikes hit hardest.
ATLAS had that sector ranked number one in early August.
But by the 3rd of September, it was dead last.
The tech index fell 13% from ATLAS’s first downgrade to the day of the hike.
An early warning signal you can access with a click of a button.
That’s what it’s like to have machine intelligence on your side.
Now, ATLAS didn’t know that was going to happen. The AI doesn’t read the news.
It reads prices.
Every sector, sub-sector and stock.
Allowing machine intelligence to become your market intelligence.
So what exactly is ATLAS looking for in those prices?
Let me lift the bonnet for a minute. It’s simpler than you might think.
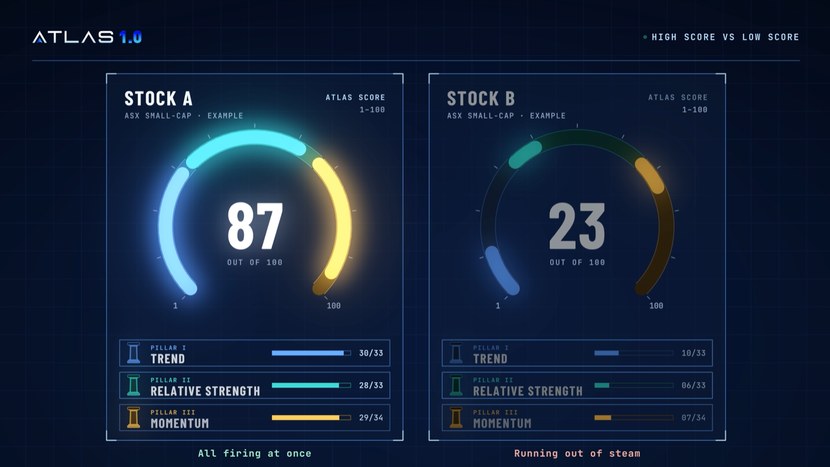
Every day, ATLAS gives every small and mid-cap stock on the ASX a single score between 1 and 100.
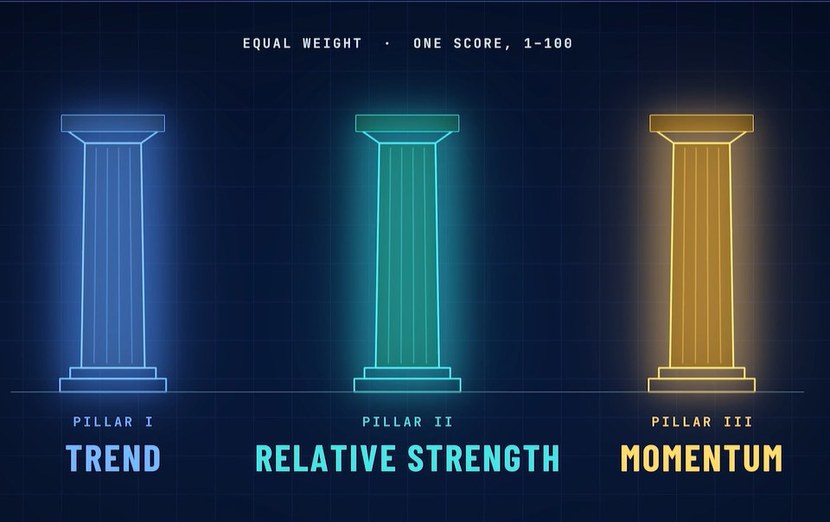
That score is built on three pillars. Each one carries equal weight, and each one asks the market a different question.
Pillar 1 is Trend
The question here is simple: is the market voting yes on this stock?
ATLAS checks whether the price is holding above its rising averages, and whether those averages are climbing faster.
Trade with the trend, and it’s like swimming with a strong current at your back. Fight it, and you’re battling against the tide.
Pillar 2 is Relative Strength
This asks: is the stock just rising with the market or its sector… or is it actually beating it?
You see, real leaders separate themselves early. They climb while the index stalls, and they hold up better when everything else pulls back.
In a year like this one, with the index going nowhere, that’s been one of the most telling signals of all.
Pillar 3 is Momentum
And it’s the one I care about most.
A stock can still be trending up while the move itself is running out of puff. What ATLAS hunts for is acceleration: a move that’s gathering force.
Think of two snowballs rolling downhill. Both are moving. But one starts picking up size and speed far faster than the other.
ATLAS measures that across several timeframes at once.
Not just whether a stock is moving, but whether the move is getting stronger or starting to fade underneath.
Put those three together and you get one number. Our ATLAS rating.

A high score means the trend, the strength and the acceleration are all firing at once.
A low score means the stock is running out of steam, or never had any.
And when those scores start falling, that’s often your earliest warning that something is changing beneath the surface.
But to be clear, it’s not a crystal ball.
Sometimes a high score fades. That’s just markets.
The goal here is to tilt the odds in your favour, with the same discipline every single week.
Now, as flat and choppy as this year has been, there’s one thing we haven’t seen since ATLAS went live.
An outright crash.
Will 2027 bring one?
I don’t know. Nobody does.
And ATLAS doesn’t predict that far ahead either.
But I can tell you what the market looks like going into it. And there are two very different paths from here.
The first one is exciting.
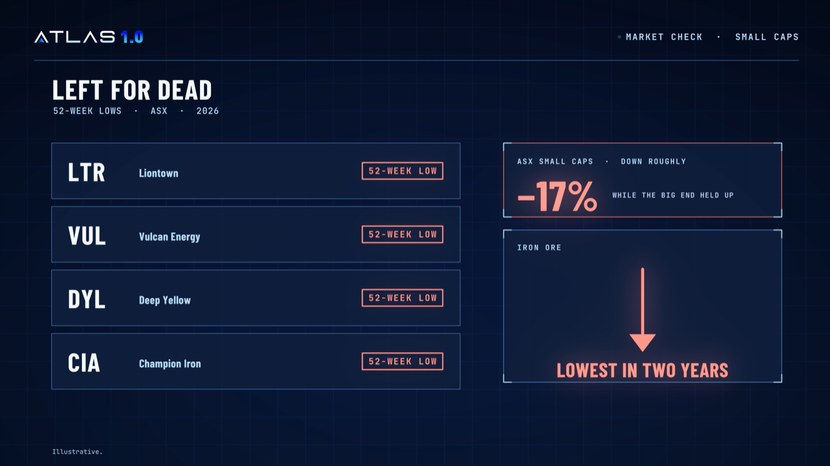
Because while the big end of the ASX has held up this year, a huge slice of the market has been left for dead.

Small caps are down roughly 17%.
Big lithium names like Liontown and Vulcan Energy are sitting at 52-week lows.
And they’re not alone. Uranium developers like Deep Yellow are scraping the bottom of the barrel.
And Iron ore has slumped to its lowest level in two years.
Meanwhile, where’s the money been crowding?
Into the AI trade overseas. And into our big banks here, to the point where CBA has been called the most expensive bank in the world.
Markets don’t stay that lopsided forever.
If investors start rotating out of what’s crowded and into what’s cheap…
…like critical minerals and the beaten-up corners of the small-cap market… those moves can be violent.
They’re exactly the kind of moves ATLAS is built to catch early.
Who knows what comes next. We’re not in the predicting game. We’re in the observing game.
Watching for the moment people start buying into those oversold opportunities.
If that shift comes in 2027… that’s when you’ll want ATLAS working for you.
But then there’s another path.
The possibility of a MUCH larger market crash.
Crashes do happen.
Every investor who’s been around long enough has lived through at least one. And they always seem to arrive at the moment people least expect them.
So when we built ATLAS, we didn’t just design it to find the next winner.
Since we haven’t had a crash since May, there’s only one honest way I can show you how ATLAS handles one.
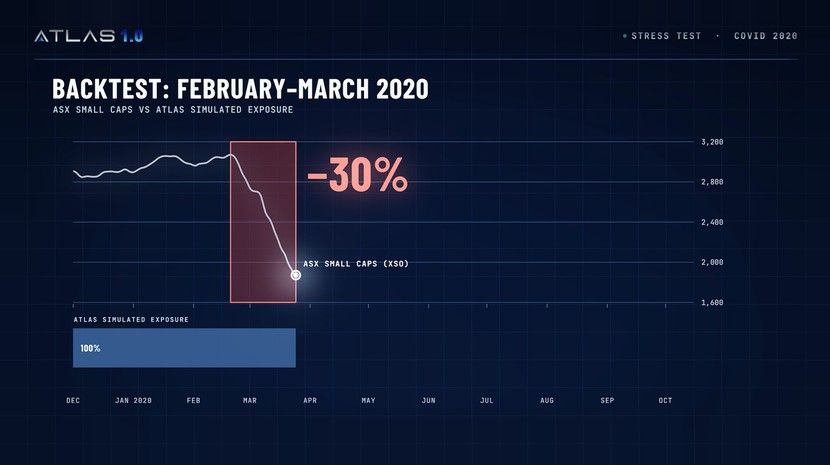
It’s from our backtesting, the historical simulations we ran before ATLAS went live.
And it’s the biggest crash most of us can remember.
COVID.
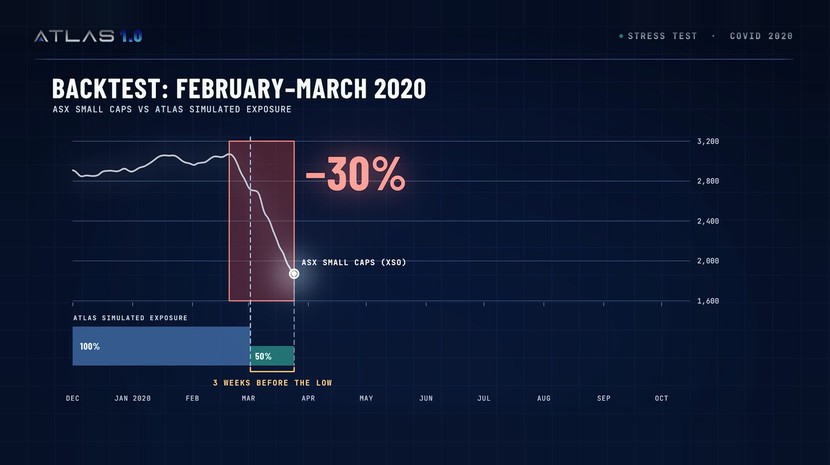
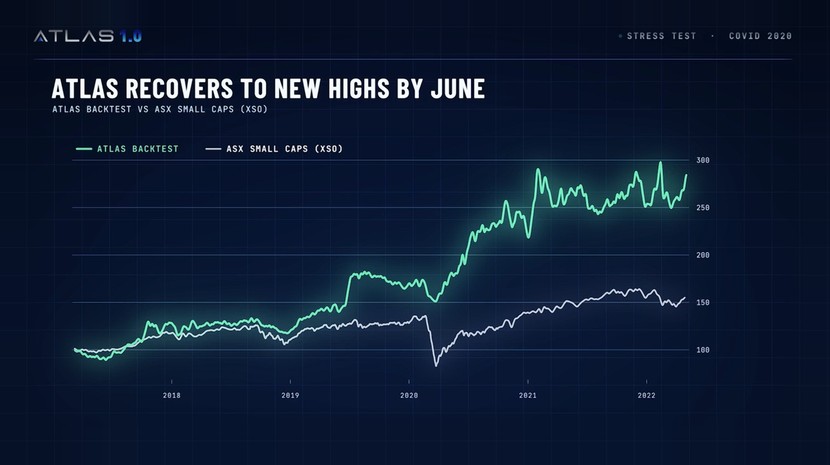
As the scale of the pandemic became clear in early 2020, ASX small caps collapsed 30%. Years of gains wiped out almost overnight.

In the simulation, ATLAS had already HALVED the portfolio.
Three weeks BEFORE the low.

It didn’t know a pandemic was coming. Nobody did.
It simply saw early trends breaking and momentum draining out across the market and acted.
Then, while the market was still falling, it was already starting to rotate toward where the money was heading next.

Again, that’s in backtest simulations. This was part of the decade of data we trained ATLAS on before it started spitting out live advice back in May.
And it doesn’t guarantee anything about the future.
But I show it to you for a reason.
If the next crash comes, it won’t look like COVID.
They never look like the last one.
What ATLAS watches for doesn’t change, though: the moment money starts rushing for the exits.
And that’s the half of ATLAS I think gives you the most genuine edge in this unpredictable, lightning-fast new investing world.
It doesn’t just tell you when to get in.
It tells you when to get out.
And honestly, that’s where most investors come unstuck.
Buying is the fun part.
Selling is where the pain lives.
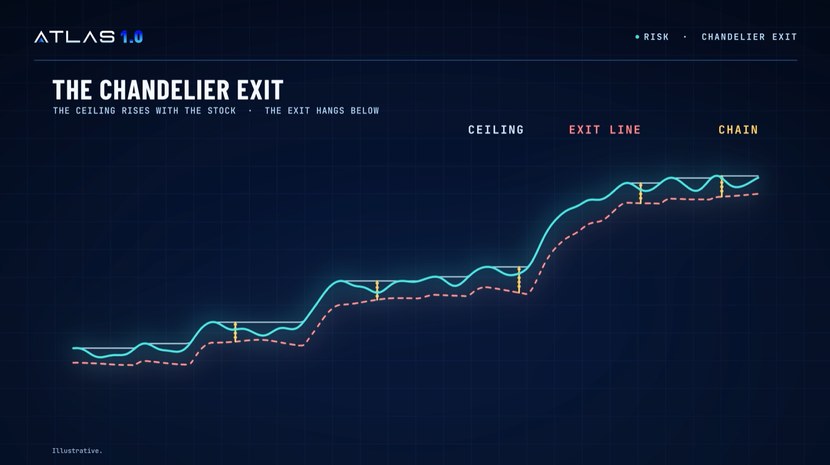
So built into ATLAS is something called a Chandelier Exit.

The name tells you how it works.
Picture a chandelier hanging from the ceiling.
Every time a stock rises, ATLAS raises the ceiling.
And hanging below it, at a safe distance, is your exit line.
As the stock climbs, the exit line climbs with it.
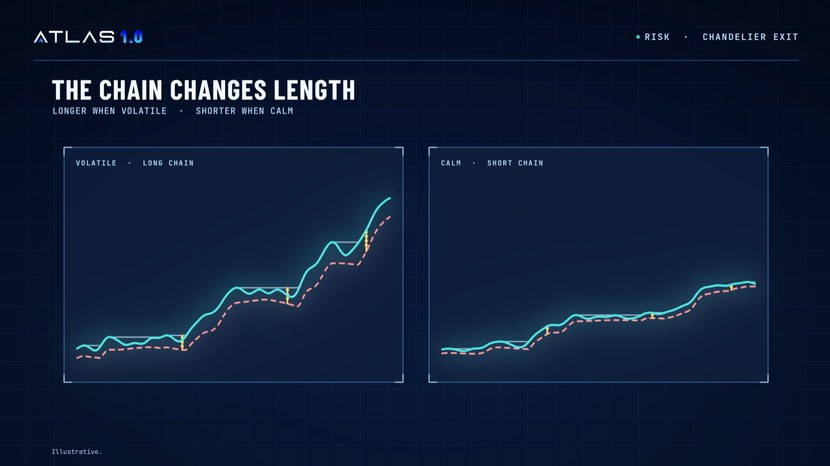
But here’s the clever part. The length of that chain changes with how wildly the stock is moving.
When a stock is volatile, the chain gets longer. It gives the position room to breathe, so you’re not shaken out on a normal wobble.
But when things are calm, the chain shortens and the exit line tightens beneath you, protecting more of your gains.

That may seem counterintuitive — having looser stop losses when markets are wilder — but it actually makes sense when you think about it.
Because if your stocks are falling sharply in calmer markets, you know something is up.
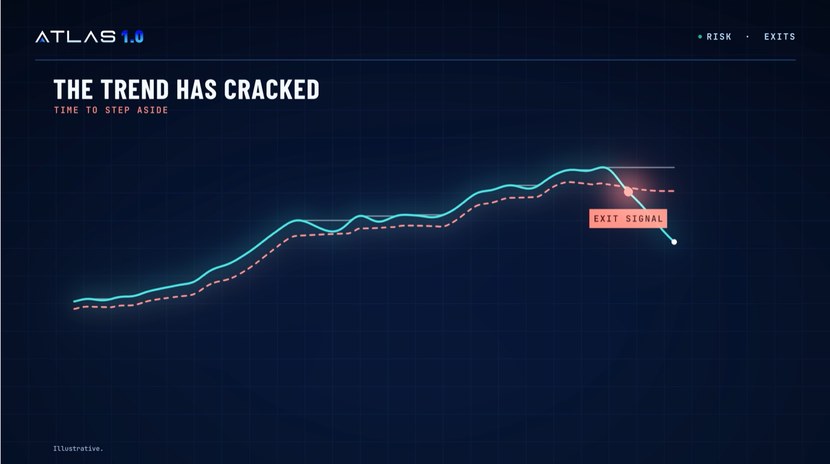
And when the price finally breaks through that line, that’s the signal.
The trend has cracked. Time to step aside.

No guessing. No “she’ll come back.” No lying awake at 2am wondering whether to sell.
Just a clear line that was drawn before your emotions ever got involved.
Now, ATLAS doesn’t sell anything for you. Remember, it never touches your account.
When one of those exit lines is hit, I’ll tell you about it directly, with clear guidance on what I’d do and why.
The machine spots the crack. I put it in context.
And the final call is always yours.
This isn’t a calm market. It’s fast, it’s noisy, and it punishes people who hang on too long.
ATLAS was built to help you get out in time, not just get in.
We’re almost at the moment we’ve been building towards.
In a few minutes, I’ll put 10 stocks on the screen.
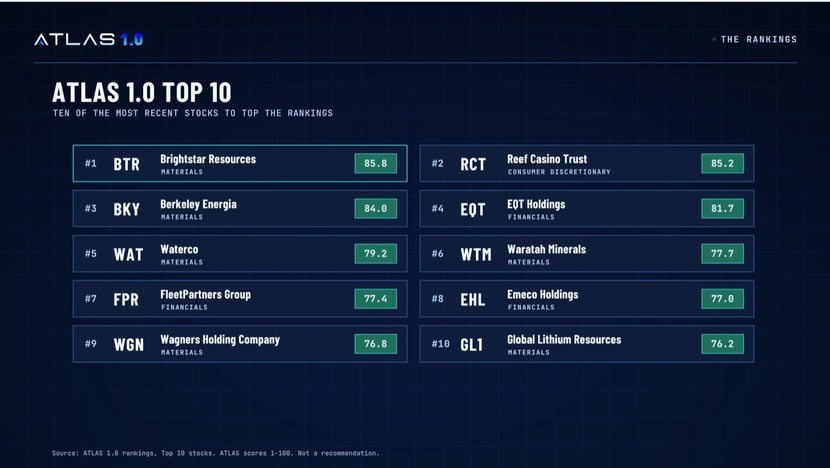
They’re among the most recent names to top the ATLAS 1.0 rankings: stocks where trend, strength and acceleration were all firing together, in a market where most of the ASX was going nowhere.
But before I do, let me show you what it’s like to have ATLAS working for you every day.
Because those 10 names are a glimpse.
What sits behind the login is the whole board, moving as the money moves.
When we launched in May, ATLAS was a promising engine with no live track record.
Since then, it’s been through five months of real markets… and real investors using it every week.
ATLAS 1.0 is what we built from all of that.
First, the rankings.
Hundreds of ASX small and mid-cap stocks, each with a single ATLAS Rating from 1 to 100.
Trend, strength and momentum, boiled down to one number. The higher the better.
Second, the whole board.
Every sector and sub-sector, ranked. So you can see where money is flowing in… and where it’s draining out.
The same view that showed property sliding to last, weeks before the rate hike.
And it now sits inside a brand-new interface, built so what’s moving is obvious at a glance.
Third, the ATLAS Top 10.
The stocks sitting at the very top of the rankings, refreshed every morning so you can trade on the days that suit your schedule.
Whether you’re a trading newbie or a day trading veteran, there’s something for you in this list.
Fourth, the exits.
Every stock ATLAS flags comes with its own Chandelier Exit tracking.
And our upgraded risk system adds a simple traffic light to every position. Green. Amber. Red.
So when momentum starts leaking out, you’ll see it long before the damage is done.
Underneath all of it sits the engine itself.
A sharper momentum model, rebuilt on five months of live market feedback.
Quicker to spot a shift. Even better at telling you when to step aside.
And then there’s me.
Each week, I’ll narrow the output down to the one setup I think deserves the closest attention. Why it’s ranking. The signals behind it. Suggested entry levels. And the risks worth watching.
These picks are bundled into the ATLAS portfolio. A list that brings the system’s strongest ideas together in one place, with clear guidance from me on when it’s time to take profits or step aside.
The machine spots the move. I put it in context. The final call is always yours.
Now, ATLAS does the heavy lifting. But any powerful tool pays you back faster when you know your way around it from day one.

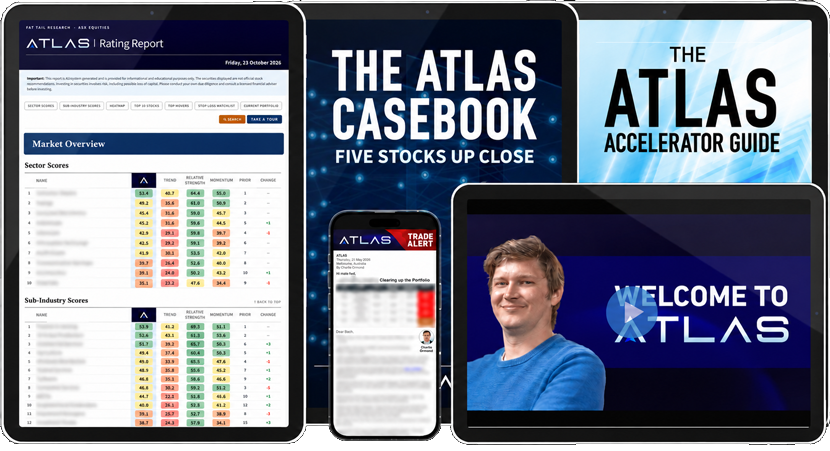
So the moment you join, your ATLAS 1.0 onboarding kit is waiting.
There are four things inside.
First, today’s Top 10.
When you log in, the latest ATLAS rankings are already on screen. That’s not the snapshot you’ll see at the end of this demo. It’s whatever ATLAS is flagging the day you arrive.
Second, my five-minute video walkthrough.
I’ll take you round the dashboard myself. I’ll show you where the rankings live and how to read a score. You’ll see how to spot a sector gathering pace, or one running out of steam, and what’s worth checking each week.
Log in, press play, and you’re away.
Third, The ATLAS Accelerator Guide.
This is your reference manual. It explains the Three Pillars in plain English, and what separates a stock scoring in the 90s from one in the 60s. It covers how the Chandelier exits tell you when it’s time to step aside. And it sets out a simple weekly routine, so ATLAS fits into your week rather than taking it over.
And fourth: The ATLAS Casebook: Five Stocks Up Close.
These are five stocks ATLAS flagged on the live market, each one pulled apart. You’ll see what the rankings showed, which signals lit up, where the sector sat at the time, and how the play unfolded.
After going through these resources, you’ll know how to read ATLAS, what to look for, and how it’s been finding opportunities so far.
So, as promised.

Take a good look. Jot them down.
Now hold them up against that list next to you.
Is one of your stocks on here? That’s worth knowing.
Is something you’ve been eyeing for months nowhere to be seen? That’s worth knowing too.
And look at the mix…

Six of the 10 come from mining, despite the reported weakness in the sector. Early money is clearly starting to flow back in.
And not a single one from energy, despite oil above US$100 a barrel.
That’s what 10 names side by side tell you that no single tip ever can. Where the money was choosing to go.
But remember what I said at the start.
This isn’t a shopping list.
Some of these names will keep climbing. Others will fade. And ATLAS will flag it when they do.
Because these rankings never sit still. They shift every time the money moves.
Ten names on one screen is a snapshot.
ATLAS 1.0 is the moving picture. Every day, across the whole board, for as long as you’re using it.
So, how do you get it?
That’s where I hand over.
I built the engine, and I’ll be the one in your inbox every week.
But the price, and the promises we make to back it, aren’t mine to set. They come from the top.
So I’ve asked our Publisher, Woody, to walk you through them.
WOODY:
Thanks, Charlie.
I hope that gave you a real feel for what ATLAS can do. Even if you decide it isn’t for you.
I’ll keep this brief. By now, you probably know whether ATLAS feels right.
So let me remind you what you’ve just seen.
The builders it pushed to the top while the rest of the market went backwards.
The sector everyone had written off… that ATLAS ranked number one nine days later.
The sector it dropped to last, weeks before the Reserve Bank moved.
And an exit line drawn before your emotions ever get involved.
When we first opened ATLAS up in May, we were asking you to trust a system that hadn’t yet been tested live.
That’s changed. It’s spent five months in one of the most chaotic markets in years. And ATLAS 1.0 is what came out the other side.
Now, a few thoughts if you’re still on the fence.
If your feed is already full of stock tips — from apps, forums, YouTube, even chatbots — ATLAS is different. A tip tells you what to buy. ATLAS shows you where the money is moving.
If AI makes you nervous, remember: it never touches your account. You stay in control.
And if you’re thinking the market’s going nowhere… that’s exactly where ATLAS has been finding its gaps.
ATLAS is not a conventional research service.
It’s a purpose-built AI engine, designed specifically for the small and mid-cap end of the ASX. The kind of thing institutional trading desks spend a fortune building in-house.
The standard price is $2,999 a year.
But for this ATLAS 1.0 intake, your first year is $1,499. A straight 50% off.
But it does have a deadline.
The ATLAS 1.0 intake closes at midnight AEDT this Saturday, the 31st of October.
After that, this offer is gone.
And you don’t have to decide anything today based on a presentation.
Because for your first 30 days, you can get right inside ATLAS and see it for yourself.
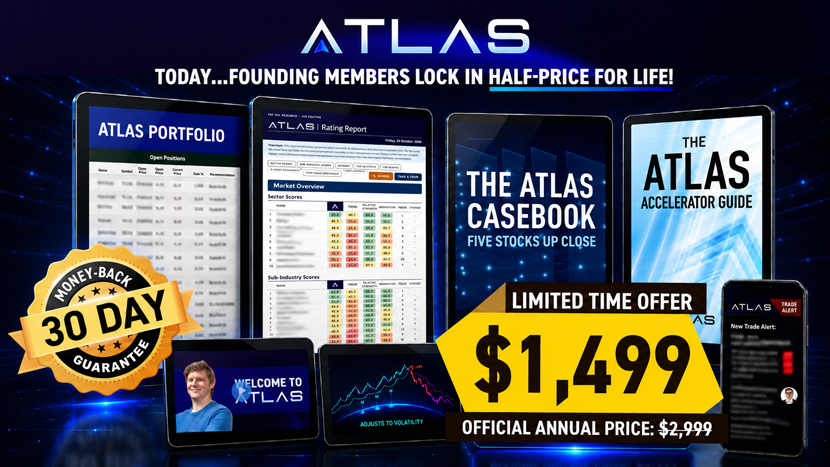
Log in on day one and run your own holdings past it. See which ones ATLAS rates highly… and which ones it’s cooling on.
Watch the sector map shift from week to week as the money moves.
Watch the Top 10 refresh. See which names hold on, and which ones fade.
Follow Charlie’s weekly setups. Watch an exit line track a stock as it moves.
That’s a month of watching ATLAS work in real market conditions. Not a demo. The real thing.
And if at any point in those 30 days it doesn’t click, or you simply decide it’s not for you, just let us know. We’ll refund your fee in full.
No hassle. No awkward questions.
But look, let’s be absolutely clear.
ATLAS will get calls wrong. This is no ‘AI miracle path’ to guaranteed profits. Obviously.
ATLAS is coded by humans, based on human knowledge, tracking a market being moved… mostly… by humans.
So, just like humans… and other AI models you use… it’ll make mistakes.
And don’t forget it is focused on small and mid-cap stocks.
Because, as you’ve seen, that’s where the momentum is.
These are higher-risk, speculative investments.
Any investor with half a brain knows these are not to be treated lightly and that momentum can move AGAINST you as well as for you.
So… with ATLAS-suggested moves… never invest more than you’re prepared to lose.
Our 1.0 model, improved as it is, is still fallible.
But it’s the same AI power the whole world is talking about… built by the independent Aussie team you already know… and put to work in your corner.
With that in mind, if you’re keen to become an early user, here’s what you get instant access to:

So, one more time, here’s everything you get:
Here’s what happens when you click the button below.
You’ll go to a secure order page. It takes a couple of minutes.
Your login arrives straight away. Watch Charlie’s five-minute walkthrough… and today’s rankings are waiting for you.
Remember the line we started with?

The size of the job you can hand an AI… and walk away.
It’s gone near-vertical in just five months. New models every week. Systems so capable, even the people building them are struggling to keep up.
That line isn’t going to flatten out for anyone.
And every step it climbs, the market moves a little faster. Stories hit overnight. Money rotates in days, not months.
Most people are watching that line and asking what AI will take from them.
You’ve just spent the last while seeing what it can make for you.
The 1.0 intake is open until midnight AEDT, Saturday the 31st of October.
If you’d rather have that accelerating power working in your corner… click the button below.
Thanks for watching.